Math and code for Are You the One?

A Lover's Tryst (undated, 19th century) by Luděk Marold, via Christie’s.
I have an unusual fondness for the reality TV dating show Are You the One? What appeals to me is not (just) the drama and drunken antics of watching a bunch of twenty-somethings compete for love and screen-time. What I really like is the math.
The math
The math on AYTO derives from its premise: 11 men and 11 women have been paired up by mysterious matchmakers into 11 “perfect matches” and the contestants need to identify their perfect match for a chance at love and (their share of) 1 million dollars (split 22 ways). The group has two ways of finding information to determine all 11 couples. The first is the straightforward “Truth Booth,” where a chosen couple gets to find out definitively whether or not they are a match. The second is the “Matchup Ceremony,” where the group pairs up into their guess at the 11 couples and finds out how many couples are correct, but not which ones, a bit like the game MasterMind or even Wordle.1 Each episode typically has one Truth Booth and one Matchup Ceremony.
With 11 men and 11 women paired into 11 heterosexual couples, there are a total of 11! (or about 40 million) possible pairings.2 Every bit of information winnows the set of possible pairings down a bit. For instance, if a lucky Truth Booth on the first episode confirms a couple, then there would only be 10! = 3.6 million pairings left—an impressive 91% reduction. If that same Truth Booth revealed that the couple wasn’t a match, then there would be 10 × 10! = 36 million pairings left, a measly 9% reduction.
The math behind figuring out the impact of one Truth Booth on the first episode isn’t so bad, but it gets a bit tricky after that. And if you’re imagining the contestants seated around a table working through the possibilities, well…it’s not exactly that kind of show. The contestants aren’t even allowed pen and paper, much less computers. Instead, they’re provided with the slightly less useful tool of seemingly unlimited amounts of alcohol.
Nevertheless, they almost always succeed in figuring it all out by the end of the season.
The code
A fan favorite way to track the group’s progress throughout the season is with a spreadsheet, like this one I made for season 4 in 2017 (check out the different tabs to see the impact of progressively more information). With some thorough book-keeping, you can deduce perfect matches and sometimes even solve the entire thing before the season is over. It’s fun, but it’s also a bit tedious.3
In 2017, when Season 5 was airing, I made ayto-calculator, a script that tracked couple probabilities as information came in. In 2019, I made pyto to handle Season 8’s unique format (see footnote 2) and gave a presentation about it at work.4
A couple of weeks ago I got an email from a fan of the German version of the show seeking help on running my code. Getting my 2017 code working again was…unpleasant, so I started thinking about how I might implement this 6 years later, with a lot more Python knowledge under my belt. A few days later when I found out that the show was coming back for another season after a three-year hiatus, I knew I had to do a real rewrite to prepare.
And so a third repo, ayto, was born. It’s available on PyPI and can be installed by anyone with pip install ayto. This is what it looks like in action:
from ayto import AYTO

guys = ["Albert", "Bob", "Charles", "Devin", "Eli"]
girls = ["Faith", "Gina", "Heather", "Ingrid", "Joy"]

season = AYTO(guys, girls)

print(season.num_scenarios)
# 120

print(season.probabilities)
#          Albert  Bob  Charles  Devin  Eli
# Faith       0.2  0.2      0.2    0.2  0.2
# Gina        0.2  0.2      0.2    0.2  0.2
# Heather     0.2  0.2      0.2    0.2  0.2
# Ingrid      0.2  0.2      0.2    0.2  0.2
# Joy         0.2  0.2      0.2    0.2  0.2

# Bob and Heather go to the Truth Booth and learn they're not a match
scenarios_remaining = season.apply_truth_booth("Bob", "Heather", match=False)
print(scenarios_remaining)
# 96

# A Matchup Ceremony with 2 beams of light (i.e. 2 correct couples)
scenarios_remaining = season.apply_matchup_ceremony(
    [
        ("Albert", "Faith"),
        ("Bob", "Gina"),
        ("Charles", "Heather"),
        ("Devin", "Ingrid"),
        ("Eli", "Joy"),
    ],
    beams=2,
)
print(scenarios_remaining)
# 17

print(season.probabilities)
#          Albert   Bob  Charles  Devin   Eli
# Faith      0.35  0.18     0.12   0.18  0.18
# Gina       0.12  0.47     0.18   0.12  0.12
# Heather    0.18  0.00     0.47   0.18  0.18
# Ingrid     0.18  0.18     0.12   0.35  0.18
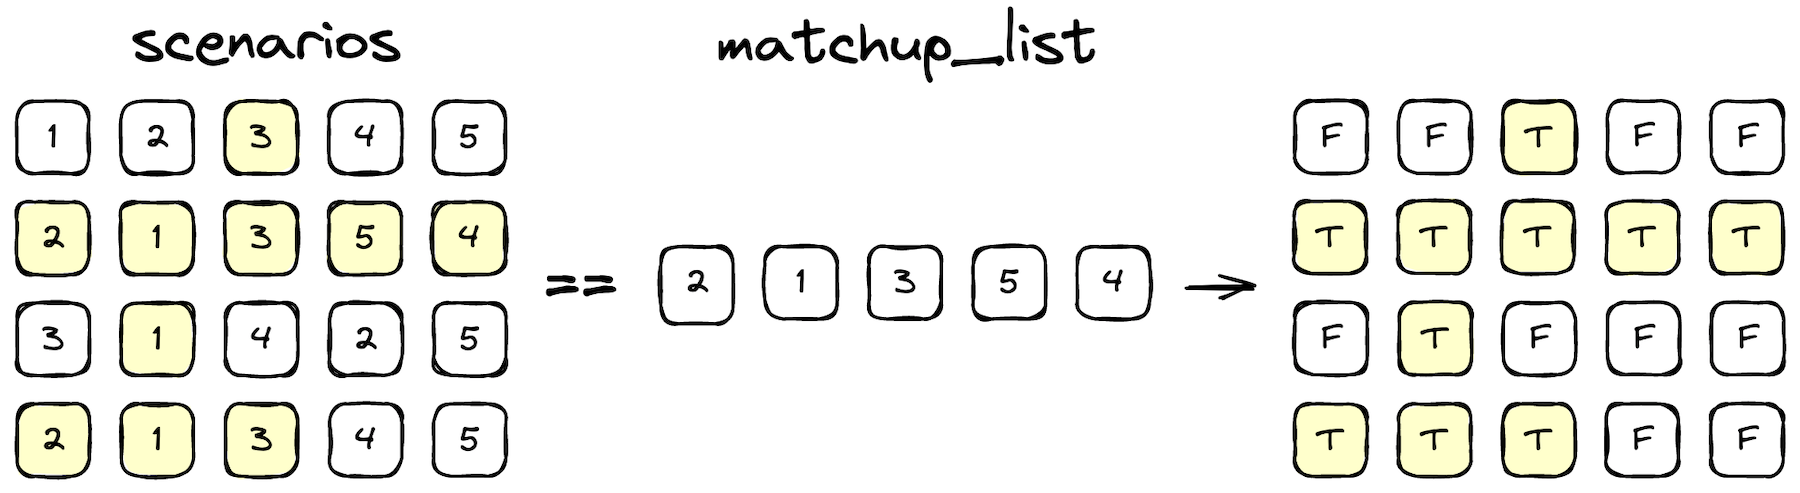
All we have to do to calculate the couple probabilities is keep track of every possible scenario and eliminate those which contradict Truth Booths and Match Ceremonies. Processing Truth Booths is straightforward: if the pair is a match, we eliminate every scenario that doesn’t feature that pair; if the pair was not a match, we eliminate every pair which does have that scenario. Matchup Ceremonies are only slightly more complex: we keep only the scenarios that share B couples in common with the couples from the Matchup Ceremony, where B is the number of beams of light (correct couples) from the ceremony.
The data structure
There are a few considerations for doing this efficiently, the first of which is how to store the scenarios. A simple and effective way to do this is to think of all the men as always being in the same fixed order. We can then represent a set of pairings by ordering the women such that the first woman in that ordering is paired with the first man, the second with the second, and so on. That is, if there are three men and three women, we can call the men 1, 2, and 3 and the women A, B, and C. Then a pairing of 1 with C, 2 with B, and 3 with A would be written CBA, and the 6 total possible pairings are ABC, ACB, BAC, BCA, CAB, and CBA.
In reality, we use integers (not letters) to represent the women, and so the starting set of all scenarios is a NumPy array 11 integers wide and roughly 40 million rows long. At first I was generating this list with Python’s itertools.permutations function, but this turned out to be rather slow, taking over 6 seconds to generate the 40 million scenarios. Luckily, Daniel Giger provides a faster NumPy permutation algorithm on Stack Overflow that reduces the time to about a quarter of a second.
Thus the above 6 combinations of 3 men and 3 women would be stored as:
[[0, 1, 2],
 [1, 0, 2],
 [0, 2, 1],
 [1, 2, 0],
 [2, 0, 1],
 [2, 1, 0]]
Pruning scenarios
Reasoning about matches plays out a little differently in the show than it does in code.
The second major consideration is how to prune the scenarios. My previous projects and my first iteration of ayto would all loop through all scenarios and loop through each pair in a scenario, checking to see how many pairs match between a scenario and a Truth Booth or Matchup Ceremony. This is very slow.
I realized that a much better way to do this would be with some clever vectorized NumPy operations. Now the pruning process for a Matchup Ceremony is effectively three lines:
sums = (scenarios == matchup_list).sum(axis=1)
idx = sums == beams
scenarios = scenarios[idx]
What’s going on here? The variable matchup_list is a 1-by-11 array of integers representing the pairing we are evaluating (e.g. the pairing chosen at the Matchup Ceremony), and scenarios is the aforementioned N-by-11 array of possible remaining pairings. Performing the comparison scenarios == matchup_list broadcasts the smaller array along the first axis of the longer one, meaning we compare the test pairing against every possible pairing in scenarios and we end up with an N-by-11 array indicating element-wise equality.
When we take the sum(axis=1) of that result, we count the number of True elements in each row and end up with an array of these counts N elements long.
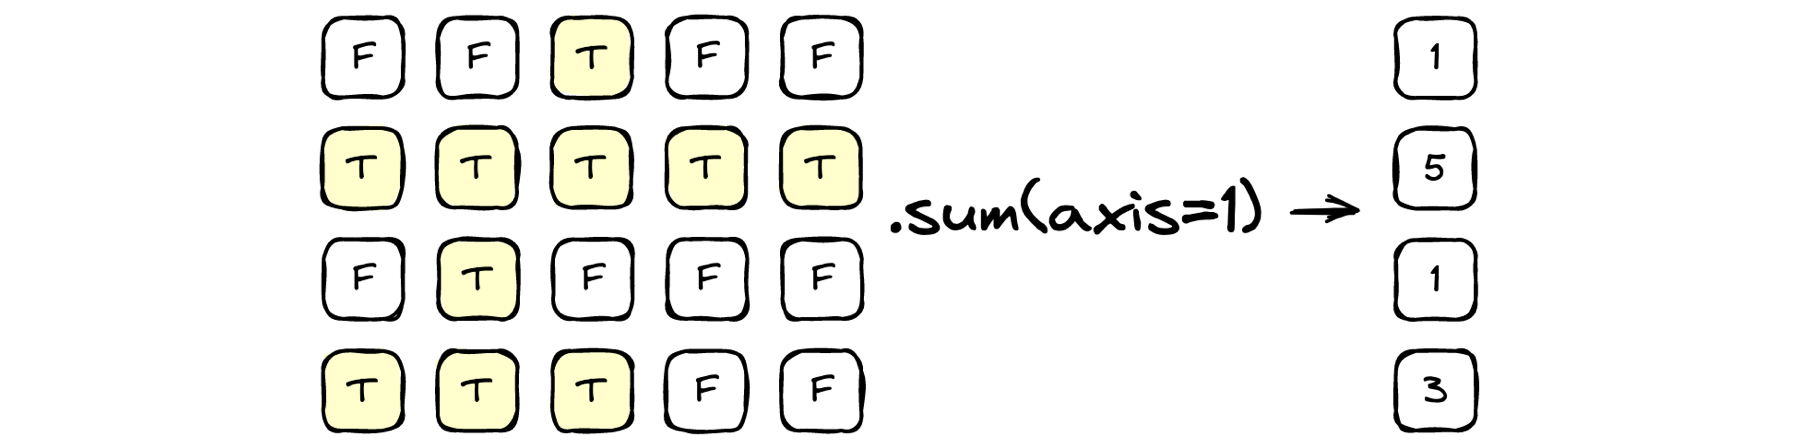
Lastly, the comparison sums == beams compares the number of Trues in each row to the number of beams produced at the Matchup Ceremony (broadcasting the comparison again). We end up with a length-N array idx of booleans, with True for the indices of scenarios that remain and False for those that have been eliminated. We can update our list of scenarios with scenarios = scenarios[idx].

Compared to naive looping, this method is about 36 times faster at applying a Matchup Ceremony to the full list of starting scenarios for 11 men and 11 women (0.9 versus 32.1 seconds). A slightly simplified version of the same logic is used for Truth Booths.
Calculating probabilities
The last step is to take this list of scenarios and calculate all 11×11=121 couple probabilities. We can cheat when we initialize the probabilities because we know they’re all 1/11, but otherwise our strategy is to see how many times each woman is paired with each man and divide it by the total number of remaining scenarios.
My first attempt at this was (once again) plain old Python loops, building up a counting dictionary. This method takes over 70 seconds to calculate probabilities after the first Truth Booth.
To speed it up, NumPy saves the day again. We still use a dictionary (a defaultdict actually) to count up how many times each woman is paired with each man, but we use NumPy’s unique function to count all the women simultaneously for each man. It looks like this:
probs = defaultdict(lambda: defaultdict(float))

for guy_idx, guy in enumerate(guys):
    # get that guy's column of the scenarios dataframe
    col = scenarios[:, guy_idx]
    # construct a dictionary counting how many times each girl_idx appears
    unique, counts = np.unique(col, return_counts=True)
    count_dict = dict(zip(unique, counts))
    for girl_idx, girl in enumerate(girls):
        # populate probs dict with probaility = counts / num_scenarios
        probs[guy][girl] = count_dict.get(girl_idx, 0) / num_scenarios
At a little over 6 seconds (the slowest operation in the library by far), this is 10 times faster than the naive loop version.5
Other niceties
Since I knew that I wanted to publish my work on PyPI, I figured I might as well adopt some best practices when it comes to Python packaging. The project is set up with pyproject.py, as defined in PEP 518, rather than the setup.py of yore. It’s got a test suite with 100% code coverage and benchmark tests that I used to compare the performance of different implementations as I iterated.
I also used GitHub Actions for CI: when I create a pull request, it automatically runs my tests and mypy on three versions of Python, and when I create a new tag, it automatically publishes it to PyPI.
And believe it or not, I haven’t even mentioned every feature in this blog post. Check out the demo notebook for a full tour of the library’s capabilities.
Parting thoughts
Whether you’re eager to get the latest probabilities each week, or you’re just curious to toy around with some code, feel free to check out the ayto repo.
I hope I’ve convinced you that Are You the One? is more than just another reality TV show. Fans of the coding project may not love the show, and fans of the show may not care about the code, but I find there to be something enjoyable in both.
-
Of course there is the third way of learning information which is the contestants getting to know each other and trying to determine—based on genuine human connection—who their matches might be. The show places an, I think, undue amount of emphasis on this component. I prefer to focus on the hard facts over the caprices of the contestants. ↑
-
The format has varied slightly over the years. Early seasons had 10 men and 10 women, reducing the space of possible pairings by an order of magnitude to 10! (or 3.6 million) pairings. Season 8 had 16 contestants, but all contestants were bisexual so anyone could be paired with anyone else, for a total of 16!/(28×8!) or about 2 million pairings. ↑
-
Or maybe it’s fun because it’s tedious. The manual spreadsheet-ing certainly provides a sense of accomplishment, while automating the work can feel a bit too easy at times. ↑
-
I’m not the only one to have this idea. Alex at Are You The One? Math has been dutifully blogging mathematical commentary since 2014 and, while he hasn’t published his code (to my knowledge), I owe him a debt for inspiring me to write my own. ↑
-
I also tried two alternatives: 1) Getting the count for each girl by doing
count = (col == girl_idx).sum(), which was marginally slower than usingnp.unique. 2) Getting the counts of women for all men simultaneously withnp.unique(scenarios, return_counts=True, axis=1)is insanely slow and might not even do what I want (I never let it run long enough to finish). ↑